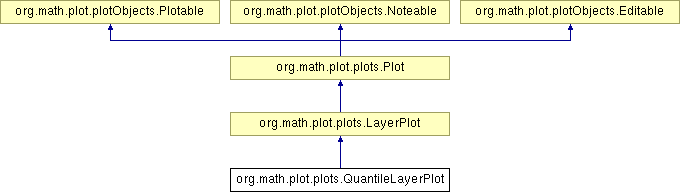
Inheritance diagram for org.math.plot.plots.QuantileLayerPlot:
Definition at line 17 of file QuantileLayerPlot.java.
Public Member Functions | |
| QuantileLayerPlot (Plot p, int a, double q, double r, boolean _symetric) | |
| QuantileLayerPlot (Plot p, int a, double[] q, double r, boolean _symetric) | |
| double | getQuantilesValue (int numCoord) |
| int | getAxe () |
| double | getQuantileRate () |
| void | plot (AbstractDrawer draw, Color c) |
| Override void | setData (double[][] d) |
| Override double[][] | getData () |
Static Public Member Functions | |
| static void | main (String[] args) |
Public Attributes | |
| boolean | symetric = false |
Static Public Attributes | |
| static int | WIDTH = 2 |
Package Attributes | |
| int | axe |
| double | quantileRate |
| Color | gradC |
| double | main_data_constant = 0 |
| double[] | Q |
| org.math.plot.plots.QuantileLayerPlot.QuantileLayerPlot | ( | Plot | p, | |
| int | a, | |||
| double[] | q, | |||
| double | r, | |||
| boolean | _symetric | |||
| ) |
Build a quantile plot based on given plot. The quantile is drawn as a linear gradient from the base plot dots.
| p | base plot | |
| a | axis number of quantile : 0=X quantile, 1=Y quantile, 2=Z quantile | |
| q | array of quantiles values | |
| r | rate of the quantile. The gradient line length is q/r | |
| _symetric | if yes, quantiles are drawn on both negative and positive sides of base plot dots |
Definition at line 56 of file QuantileLayerPlot.java.
References org.math.plot.plots.QuantileLayerPlot.axe, org.math.plot.plots.Plot.getData(), org.math.plot.plots.Plot.name, org.math.plot.plots.QuantileLayerPlot.Q, org.math.plot.plots.QuantileLayerPlot.quantileRate, and org.math.plot.plots.QuantileLayerPlot.symetric.
00056                                                                                          {
00057                 super(r + " quantile of " + p.name, p);
00058                 if (q != null)
00059                         Array.checkLength(q, p.getData().length);
00060                 Q = q;
00061                 axe = a;
00062                 quantileRate = r;
00063                 symetric = _symetric;
00064
00065         }
| void org.math.plot.plots.QuantileLayerPlot.plot | ( | AbstractDrawer | draw, | |
| Color | c | |||
| ) | [virtual] |
Implements org.math.plot.plots.Plot.
Definition at line 79 of file QuantileLayerPlot.java.
References org.math.plot.plots.QuantileLayerPlot.axe, org.math.plot.render.AbstractDrawer.drawLine(), org.math.plot.plots.QuantileLayerPlot.gradC, org.math.plot.plots.QuantileLayerPlot.main_data_constant, org.math.plot.plots.QuantileLayerPlot.Q, org.math.plot.plots.QuantileLayerPlot.quantileRate, org.math.plot.render.AbstractDrawer.resetGradient(), org.math.plot.render.AbstractDrawer.setColor(), org.math.plot.render.AbstractDrawer.setGradient(), org.math.plot.render.AbstractDrawer.setLineType(), org.math.plot.render.AbstractDrawer.setLineWidth(), org.math.plot.plots.QuantileLayerPlot.symetric, and org.math.plot.plots.QuantileLayerPlot.WIDTH.
00079                                                        {
00080                 if (!plot.visible)
00081                         return;
00082
00083                 draw.setColor(c);
00084                 gradC = new Color(c.getRed(), c.getGreen(), c.getBlue(), (int) (255 * (1 - quantileRate)));
00085
00086                 draw.setLineType(AbstractDrawer.CONTINOUS_LINE);
00087                 draw.setLineWidth(WIDTH);
00088                 if (main_data_constant == 0)
00089                         for (int i = 0; i < plot.getData().length; i++) {
00090                                 double[] d = Array.getRowCopy(plot.getData(), i);
00091                                 d[axe] += Q[i];
00092                                 draw.setGradient(plot.getData()[i], c, d, gradC);
00093                                 draw.drawLine(plot.getData()[i], d);
00094                                 // draw.drawDot(d, RADIUS/*(int)(RADIUS*quantileRate)*/);
00095
00096                                 if (symetric) {
00097                                         d[axe] -= 2 * Q[i];
00098                                         draw.setGradient(plot.getData()[i], c, d, gradC);
00099                                         draw.drawLine(plot.getData()[i], d);
00100                                         // draw.drawDot(d, RADIUS/*(int)(RADIUS*quantileRate)*/);
00101                                 }
00102                         }
00103                 else
00104                         for (int i = 0; i < plot.getData().length; i++) {
00105                                 double[] d = Array.getRowCopy(plot.getData(), i);
00106                                 d[axe] += main_data_constant;
00107                                 draw.setGradient(plot.getData()[i], c, d, gradC);
00108                                 draw.drawLine(plot.getData()[i], d);
00109                                 // draw.drawDot(d, shape/*RADIUS/*(int)(RADIUS*quantileRate)*/);
00110
00111                                 if (symetric) {
00112                                         d[axe] -= 2 * main_data_constant;
00113                                         draw.setGradient(plot.getData()[i], c, d, gradC);
00114                                         draw.drawLine(plot.getData()[i], d);
00115                                         // draw.drawDot(d, RADIUS/*(int)(RADIUS*quantileRate)*/);
00116                                 }
00117                         }
00118                 draw.resetGradient();
00119                 draw.setLineWidth(AbstractDrawer.DEFAULT_LINE_WIDTH);
00120
00121         }
 1.5.1
1.5.1